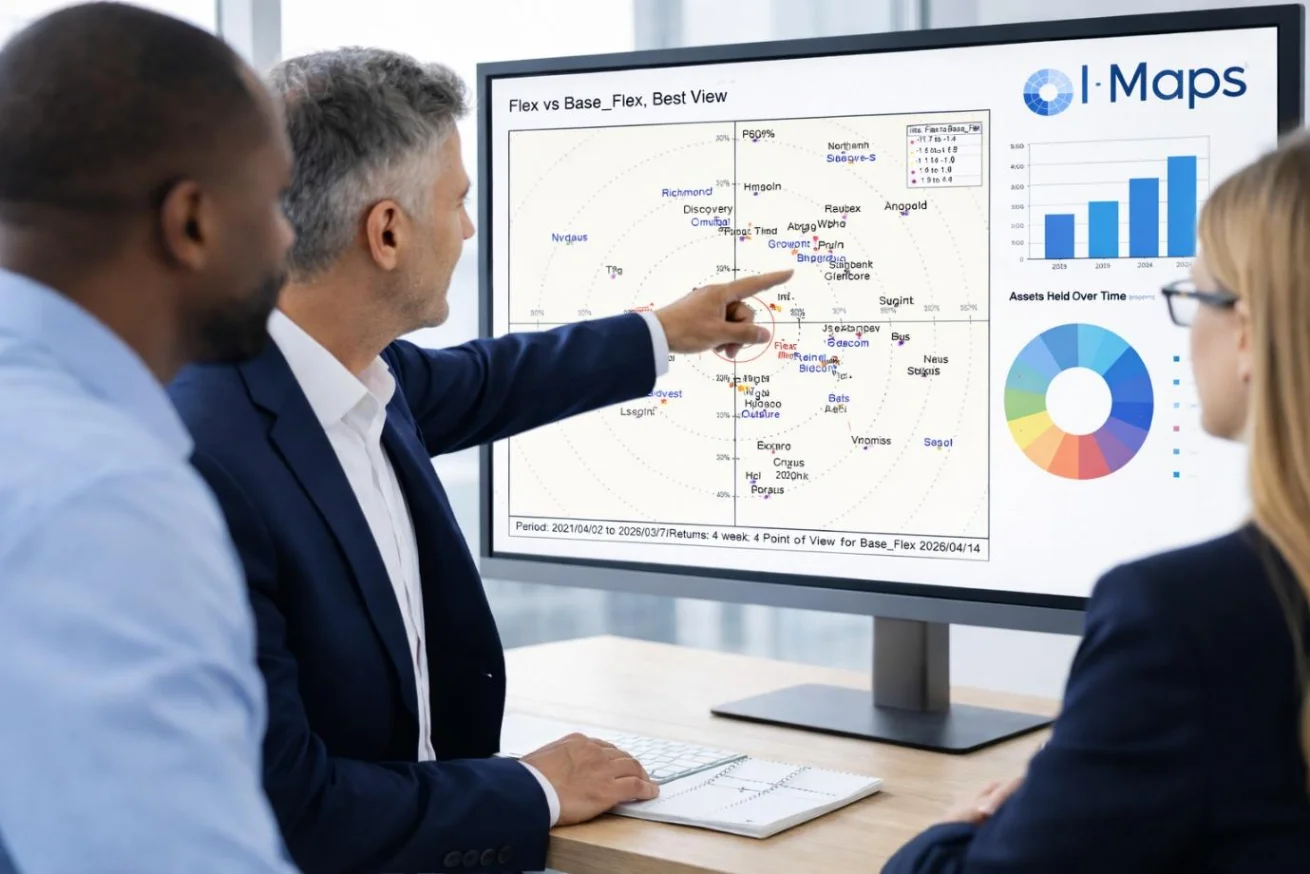
I-Maps is a portfolio construction and risk platform that enables investment teams to visualise the investment environment and position portfolios with clarity. By turning complex data into clear, map-based insights, I-Maps gives decision-makers a practical way to understand what is driving risk and where opportunities or vulnerabilities may be building.
See the Full Picture of your
Portfolio Positioning
Transform how you understand and manage portfolio risk through intuitive, map-based analysis that enables you to build, compare, and position portfolios with confidence. Whether you are reviewing a single fund, analysing a peer group, or comparing multiple strategies against a benchmark, with I-Maps you move from raw numbers to clear insight. This makes it easier to identify changes in market structure, spot concentration risk early, and communicate decisions more effectively across investment teams and stakeholders.
Explore the tools that help you understand risk, test decisions, and communicate portfolio insights clearly. From investment maps that bring structure and positioning to life, to analytics that reveal the drivers of portfolio behaviour at both portfolio and security level, I-Maps supports a complete portfolio review process. These insights help investment teams assess risk more consistently, strengthen decision-making, and present portfolio outcomes in a way that is easier to interpret.
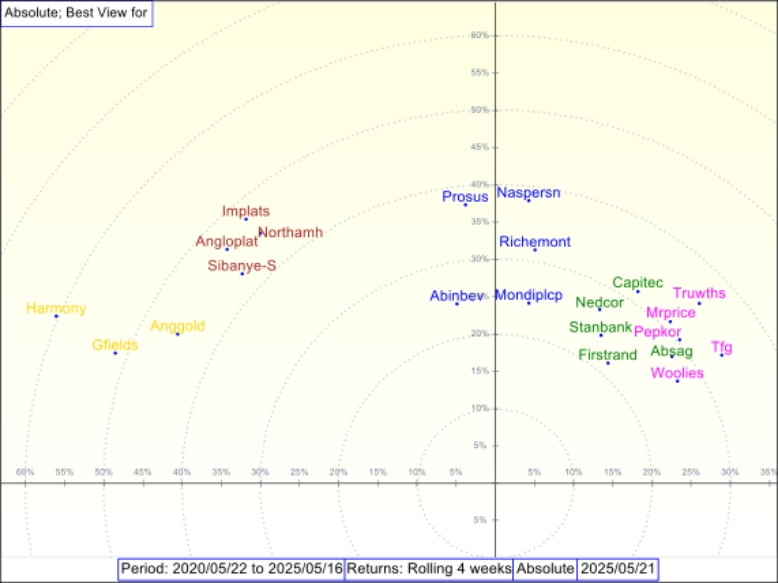
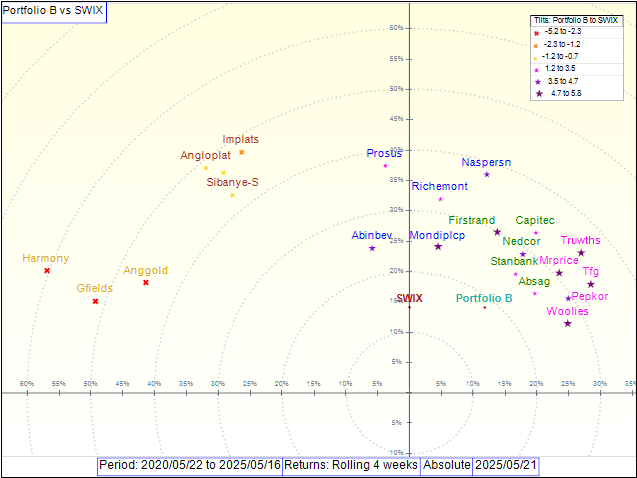
I-Maps uses intuitive investment maps to show volatility and correlation together, helping investment professionals understand the structure of the investment landscape at a glance.
Intuitive Investment Maps
Instantly grasp the investment landscape through an intuitive map.
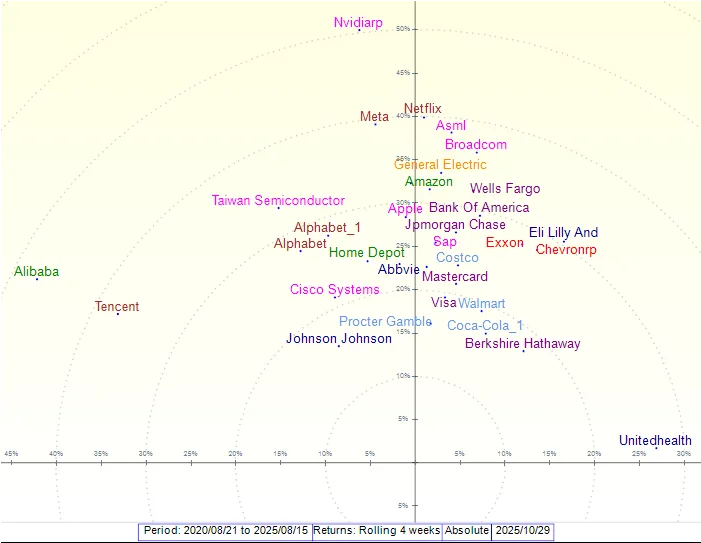
View Different Investment Universes
Customize the map to see only your chosen universe.
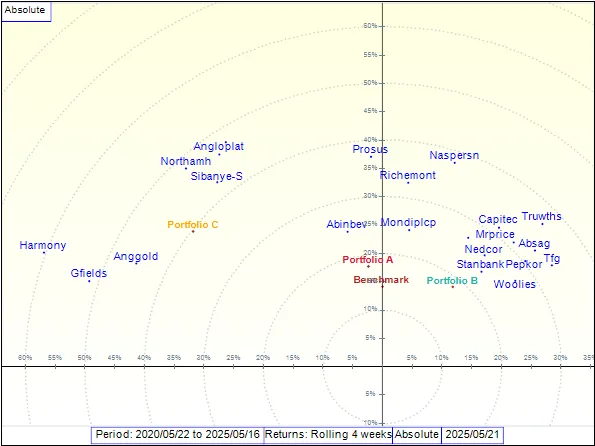
Portfolio Positioning on the Map
Easily understand your portfolio’s position in the investment universe, relative to peers and benchmarks.
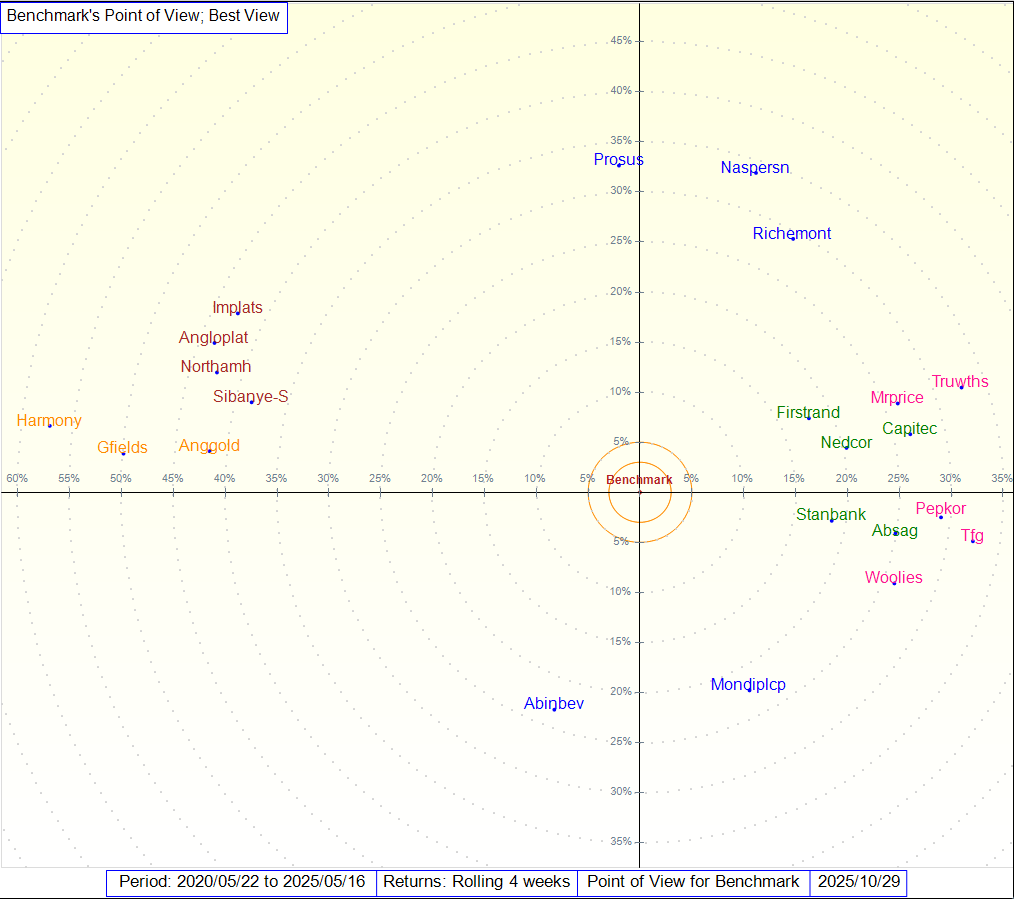
Change Your Point of View
Position the investment universe relative to your chosen center point.
View Active Positions and Tilts
Easily identify risk concentrations and diversification opportunities from active positions.
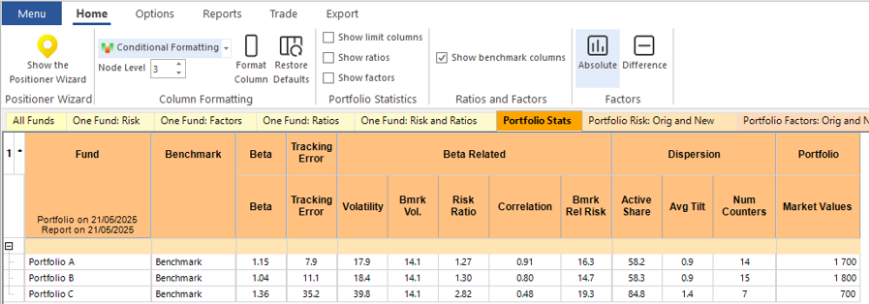
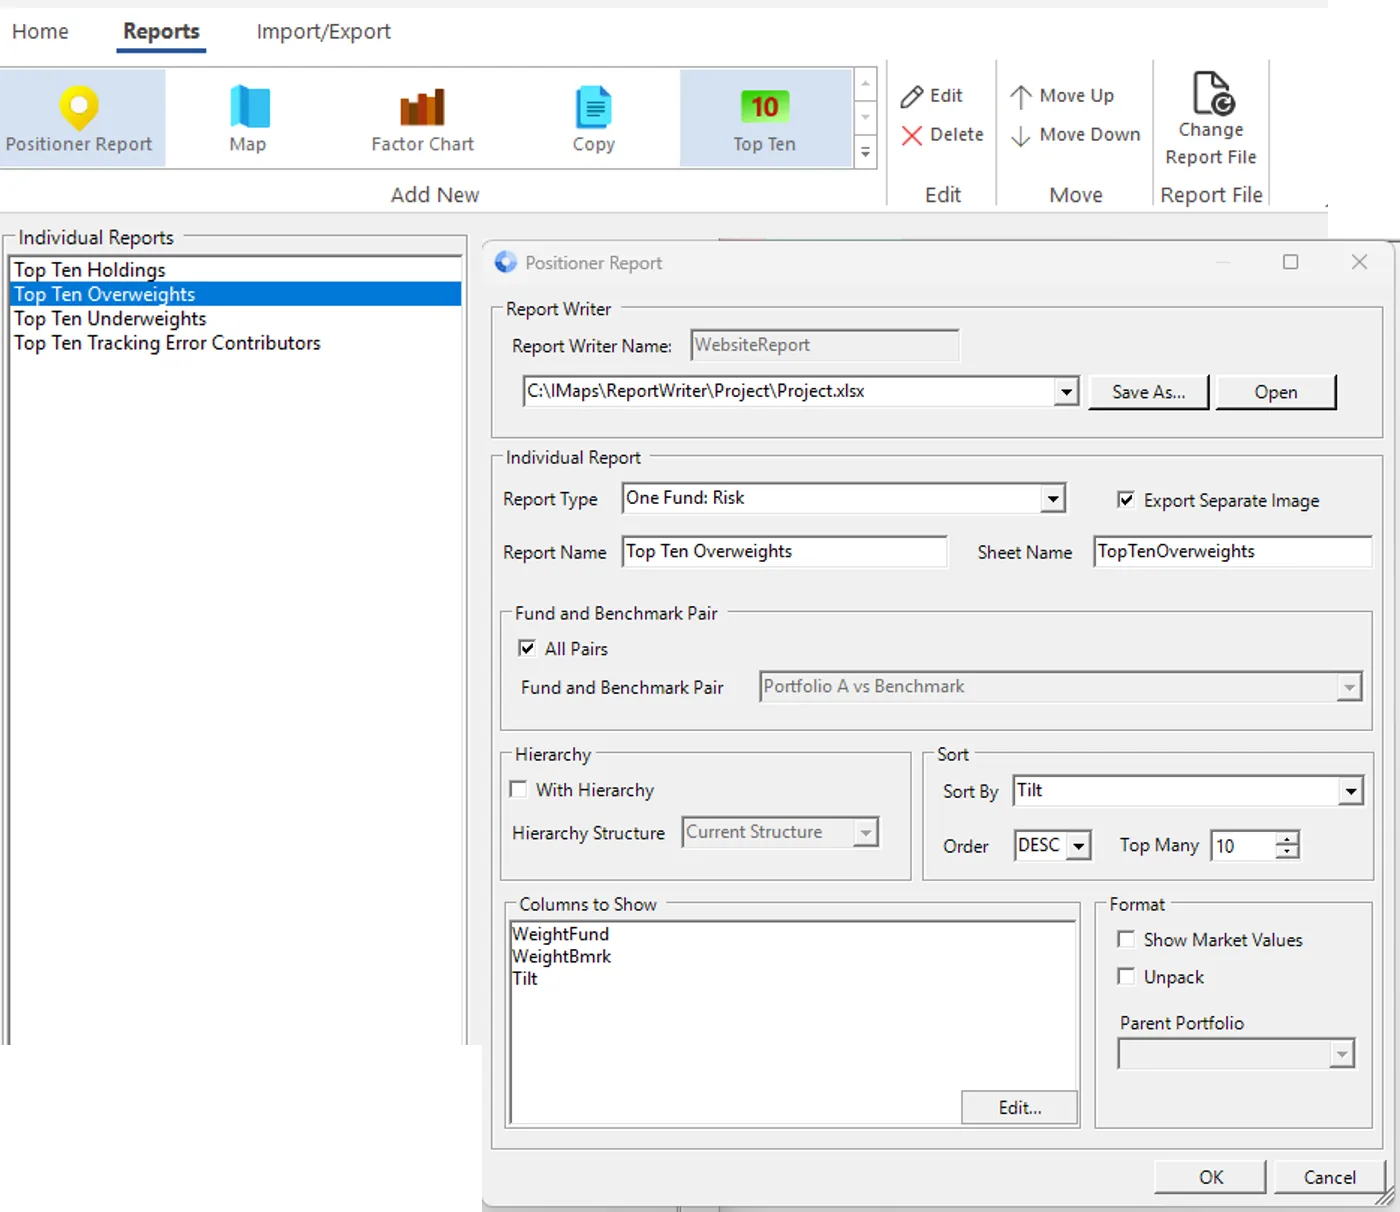
Explore portfolio construction in greater depth with comprehensive risk analytics, including beta, tracking error, volatility, dispersion, factor sensitivity, and custom measures such as valuation or ESG scores.
Comprehensive Risk Analytics
Dive deeper into risk management with a wealth of statistics and charts that empower you to make data-driven decisions.
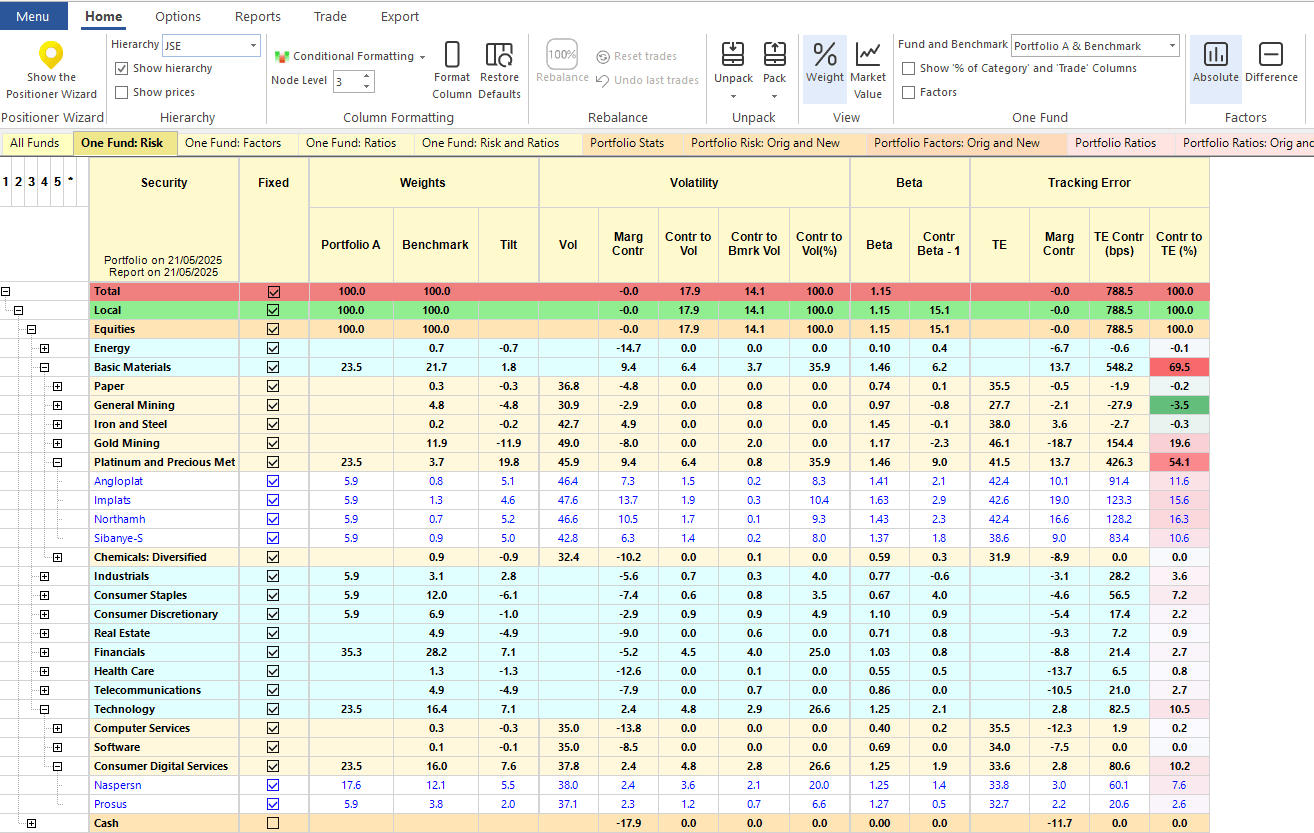
Risk Statistics at Portfolio and Security Level
Pinpoint how each security and sector contributes to your overall risk profile.
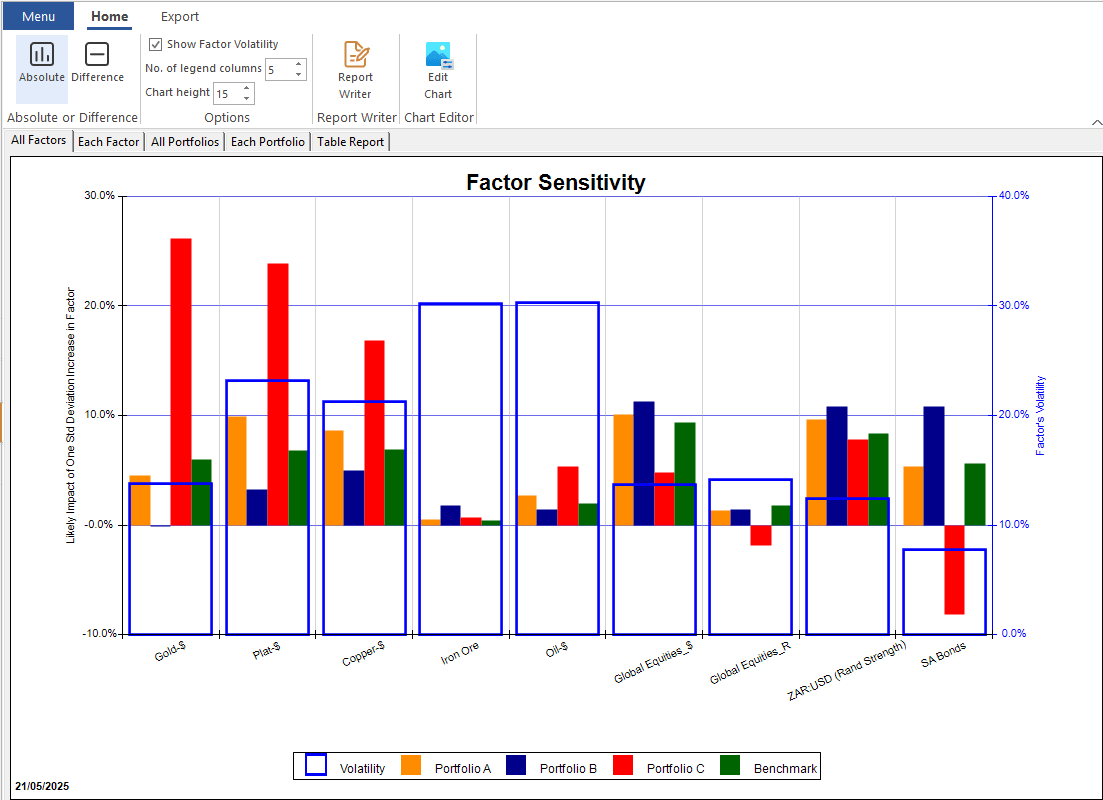
Factor Sensitivity Analysis
Assess your portfolio’s sensitivity to various factors – commodities, indices, currencies, and more.
Test hypothetical trades and see how changes affect portfolio risk, positioning, and exposure before executing decisions.
Trade Scenario Testing
Execute hypothetical trades live in the system and immediately observe their impact on your portfolio’s risk profile.
Dynamic Visual Updates
Watch your portfolio map reconfigure after trade modelling, highlighting shifts in positioning, exposures, and concentrations.
Advanced Trade Options
Automated rebalancing, align funds to targets, incorporate portfolio flows, filter out small trades, and generate a comprehensive trade report.
Create custom automated reports, including maps, analytics, portfolio comparisons, and historical analysis.
Customised Reports
Create comprehensive reports built around your unique requirements, highlighting the metrics and analyses that matter most to your decision-making.
In-Person Reporting
Dive deeper with optional face-to-face presentations that translate complex data into clear, actionable intelligence.
Historical Analysis
Leverage our proprietary “Signature” and “BackDater” features for in-depth historical reporting, trend exploration, and robust back-testing.
We offer customised development to integrate I-Maps with your existing systems and workflows, ensuring the platform supports your specific investment process. Whether you need new visual outputs, custom calculations, workflow enhancements, or data pipeline changes, I-Maps can be adapted so the platform fits the way your team works rather than forcing you to change your process.
Customisations can include
Specific trading tools
Bespoke reports
Integrated logs and record-keeping
Data formatting processes
Access ongoing expert support and personalised guidance to help you get maximum value from I-Maps and your portfolio data.
Onboarding and Training
Get up and running quickly with structured onboarding tailored to your team’s workflows, data sources, and objectives. We make sure your setup is right from day one.
Ongoing Expert Support
Enjoy on-demand support from our team of seasoned I-Maps specialists.
Insight Maximisation
Work with our technical specialists to uncover deeper insights from your data and ensure you get more from every I-Maps capability as your needs evolve.
I-Maps supports a wide range of investment professionals, including asset managers, fund managers, risk analysts, portfolio construction teams, multi-managers, consultants, and research teams. The platform is designed to be valuable across investment roles, helping each team see risk and positioning clearly, explore portfolio behaviour with confidence, and communicate insight in a way that is consistent and easy to interpret.
Asset Managers
Fund Managers Risk Analysts Client Reporting Teams
Multi-Managers
Portfolio Construction Teams Due Diligence Analysts Operations Teams
Fund Consultants
Consultant Teams Research Associates Client Presentations
How investment maps help improve portfolio decision-making
Portfolio managers work with an enormous amount of information. Holdings, benchmarks, correlations, sectors, currencies, investment styles and risk measures all contribute to the way a...
Factor investing focuses on identifying the characteristics that influence how securities behave in the market. Understanding these factors helps investors explain why a portfolio is...
Factors are one of the most useful ways to understand what is really driving a portfolio’s behaviour. They can reveal exposures that are not obvious...